How to Add Graphs in Capcut-A Step-by-Step Guidee
Adding graphs to your creations makes them smoother, more dynamic, and special. It enhances the keyframe transitions and many other effects. It makes it simple and easy to determine and highlight the zoom movements. Capcut is a top-rated video editing software among its users because of its many effects, filters, transitions, and user-friendly interface. In addition to its basic video editing tools and functions, you can also add graphs to your clips. The process of adding graphs is quite simple and easy. If you are new to Capcut or video editing, don’t worry. This article will explain every step of adding graphs in Capcut.
How To Add Graphs In Capcut
Capcut graphs are two-dimensional. Time is represented horizontally while changing values such as speed changes, transitions, and camera movement are represented vertically.
To use graphs, first, you need to add keyframes to your project. Keyframes will help you define the starting and ending points. Graphs cannot be used without adding keyframes. Here we will explain step by step how to use graphs on Capcut including how to add keyframes.
- Open the app, start a new project, and add a clip to your project.
- Tap the video layer to select and edit, or you can click on the “Edit” button.
- Move the playhead to define the points where you want to start the animation. Now tap on the “Keyframe Icon” to add your first keyframe to the project.
- Click here to see a step-by-step guide on how to use keyframes in Capcut.
- Now add a second keyframe where you have decided to end the animation. You can make some changes between these two frames like by pinching on the screen you can add a zoom-in effect.
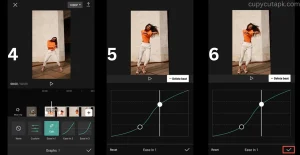
- Place the playhead between two frames and tap on the “Graph” button from the bottom toolbar. Swipe the toolbar to the left side to find the Graph button at the end of it.
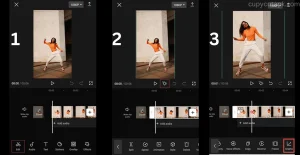
- After clicking on the graph button, you will see the multiple graph templates. Choose the one you like the most.
- There would be a pencil icon on the graph you selected. Click the pencil to edit the added graph. Adjust the graph curve to make your animation move faster by steepening it, or flatten it to keep the animation moving slowly and smoothly.
- Finally, checkmark your project and preview it before exporting it to the device gallery.
This feature is also available on Capcut PC. You can use it on a PC with a bigger screen to take your videos to new heights and make them stand out.
Final Thoughts
Using graphs on Capcut is a great way to improve the videos and make them attractive to an audience. In addition to the graphs, you can use other features like effects, stickers, emojis, music, etc to get an extra kick. Moreover, adding slow motion is another way to make your videos look more professional and catchy.
Have you ever used graphs on Capcut? Share your experience in the comments below. We would love to hear from you.

